Essential Strategies for Effectively Leveraging the Relative Strength Index (RSI)
What is the Role of the Relative Strength Index (RSI) in Cryptocurrency Trading?
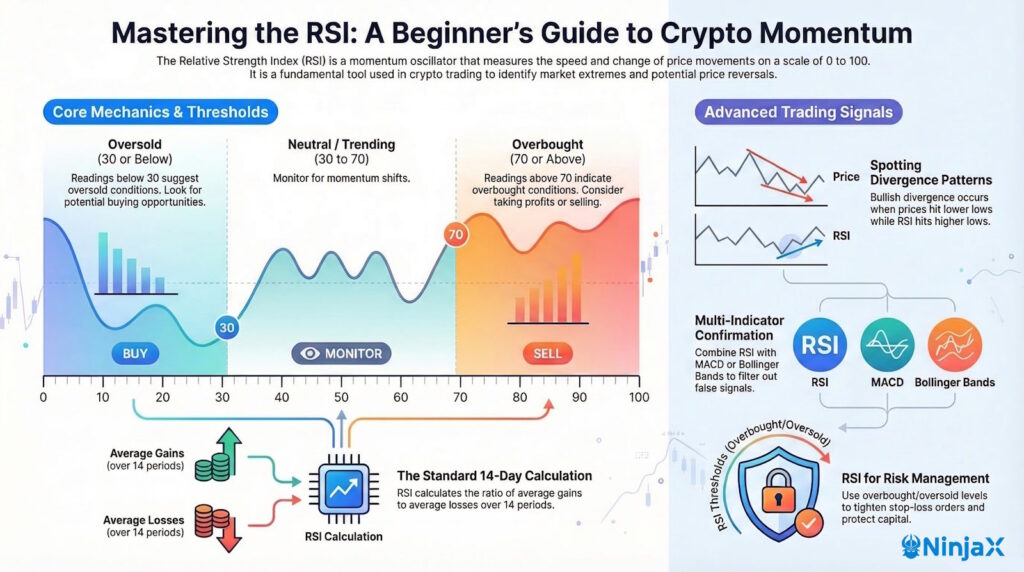
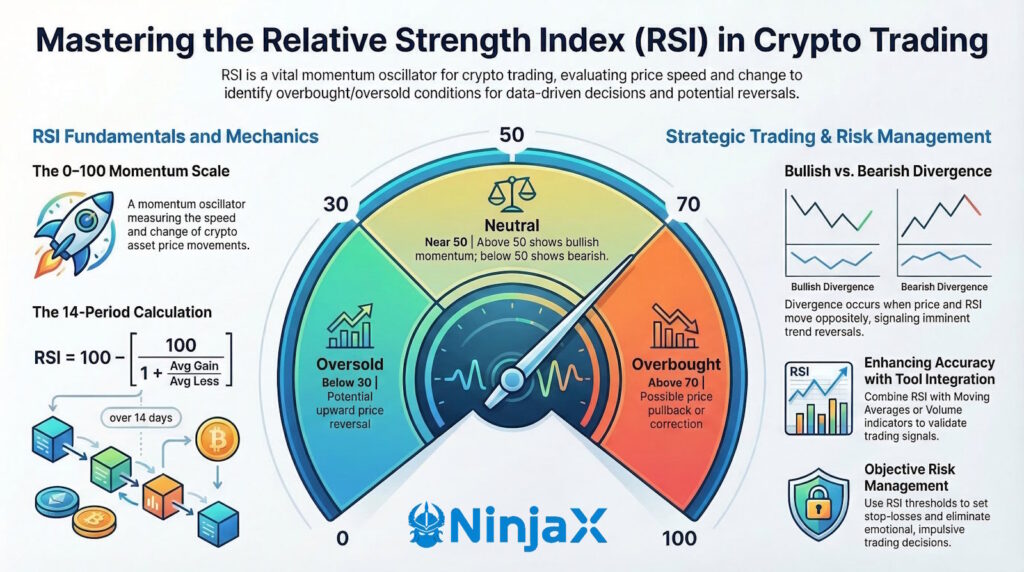
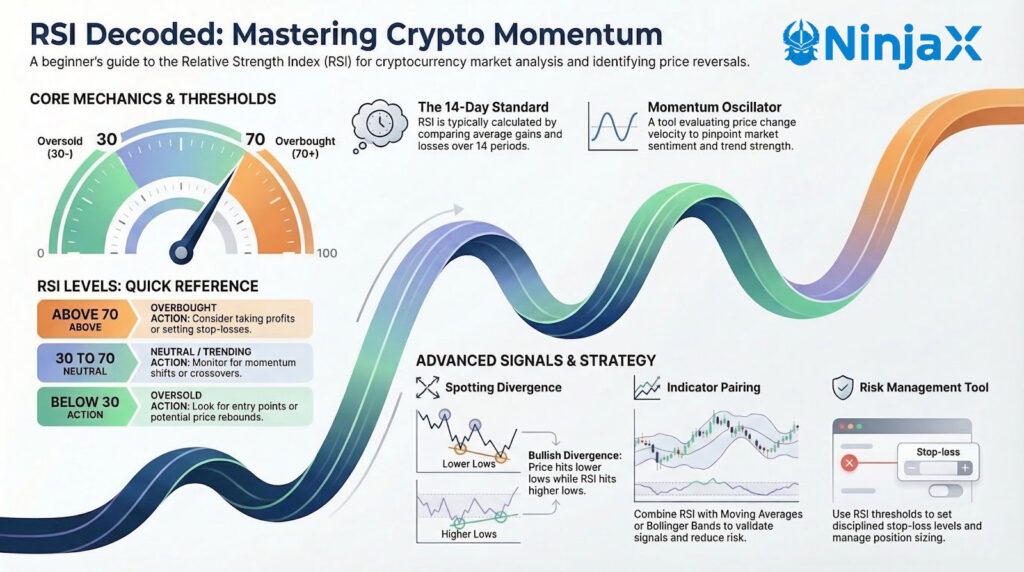
The Relative Strength Index (RSI) serves as a fundamental momentum oscillator widely utilised in crypto trading to quantify the speed and variability of price movements in digital assets. This vital tool significantly aids traders in identifying overbought and oversold conditions, typically represented on a scale from 0 to 100. Attaining a thorough understanding of RSI is critical for traders aiming to adeptly navigate the volatile landscape of cryptocurrency.
By focusing on recent gains and losses, the RSI proves to be an invaluable resource for assessing market momentum, thereby enabling traders to make informed choices. Its capability to highlight potential price reversals is especially advantageous, establishing it as a key asset in the fast-paced world of cryptocurrency trading.

The RSI is frequently viewed as a foundational indicator within both technical analysis and trading strategies. When evaluating cryptocurrencies, traders often refer to the RSI for insights concerning probable price movements.
Generally, an RSI reading exceeding 70 suggests that an asset is overbought, indicating that a price correction may be imminent. Conversely, an RSI reading below 30 indicates that a cryptocurrency is oversold, hinting at a potential opportunity for price recovery. This dual interpretation empowers traders to effectively navigate the unpredictable nature of cryptocurrency markets.
How to Accurately Compute RSI Values for Cryptocurrencies?
Calculating the RSI entails several crucial steps to ensure precise evaluations of cryptocurrency momentum. The standard calculation period is typically established at 14 days, making it necessary to scrutinise price changes within this timeframe. Below is a clear and informative outline of how to accurately compute RSI values:
- Identify the price changes from one period to the next.
- Segregate these price changes into gains and losses.
- Calculate the average gain over the 14 periods.
- Calculate the average loss over the 14 periods.
- Determine the relative strength (RS) by dividing the average gain by the average loss.
- Utilise the RSI formula: RSI = 100 – (100 / (1 + RS)).
By diligently following these steps, traders can derive the RSI value, enabling them to effectively evaluate market conditions. Accurate calculations yield more reliable trading decisions, which is particularly essential in the fluctuating environment of cryptocurrency.
What Are the Key Components of RSI Charts for Effective Analysis?
RSI charts are specifically designed to deliver visual insights into the momentum of cryptocurrency markets. These charts display several critical components that assist in interpreting overbought and oversold conditions. Key elements include the RSI line, which tracks the index, and horizontal lines at the 30 and 70 levels, serving as thresholds for identifying potential reversal points. These levels hold significant importance as they indicate when an asset may be overbought or oversold.
When the RSI crosses above 70, it typically signals that the cryptocurrency may be in overbought territory, suggesting that a price correction could be around the corner. Conversely, when the RSI dips below 30, it indicates oversold conditions, hinting that prices may soon recover. Understanding these critical levels can significantly enhance traders’ decision-making processes, empowering them to take proactive actions based on current market dynamics.
Understanding the Significance of the Relative Strength Index (RSI) in Crypto Trading
What Is the Fundamental Mechanism of RSI in Trading?
The core mechanism of RSI involves comparing upward and downward price movements within cryptocurrency markets, signalling potential trends. By analysing historical price data, RSI operates on the principle that price movements exhibit momentum: significant upward movements may lead to subsequent price corrections, and vice versa.
Traders utilise RSI to observe the relationship between gains and losses, effectively creating a momentum indicator that mirrors market sentiment. As a cryptocurrency’s value rises rapidly, the RSI will also increase, often leading to overbought conditions. Conversely, if a cryptocurrency continues to decline, the RSI will drop, indicating it is in oversold territory. This dynamic mechanism provides traders with an effective and straightforward means to gauge market trends and anticipate shifts in price direction.
What Are the Key Advantages of Utilising RSI for Traders?
The RSI offers numerous benefits that enhance decision-making for traders within the cryptocurrency landscape. One significant advantage lies in its ability to signal shifts in momentum, enabling traders to adapt their strategies accordingly. For instance, when the RSI indicates overbought conditions, traders may contemplate taking profits or implementing risk management techniques to protect their capital. Conversely, oversold conditions may prompt traders to consider entering long positions, anticipating potential price recoveries.
Furthermore, RSI assists traders in avoiding emotional trading decisions. By relying on a calculated indicator rather than instinct, traders can execute data-driven strategies that enhance their chances of success. This objective approach proves particularly advantageous in the highly emotional environment of cryptocurrency trading, where market fluctuations can provoke impulsive reactions. Traders who effectively leverage RSI analysis tend to make more rational decisions, ultimately leading to improved trading outcomes over time.
Which Key RSI Indicators Should Traders Closely Monitor?
In cryptocurrency analysis, certain RSI indicators hold substantial significance. The most critical among them are crossover points and divergence patterns. Crossover points occur when the RSI line crosses above or below key thresholds, providing traders with actionable insights. For example, an upward crossover above the 30 level may suggest a bullish reversal, while a downward crossover below the 70 threshold can indicate a bearish trend.
Divergence patterns are equally crucial and can offer early warnings of potential price reversals. A bullish divergence occurs when a cryptocurrency’s price forms a lower low while the RSI creates a higher low. This discrepancy may signal a weakening downtrend, suggesting that a price reversal could be imminent. Conversely, a bearish divergence is identified when the price reaches a higher high while the RSI records a lower high, indicating potential selling opportunities. By closely monitoring these indicators, traders can enhance their signal-reading accuracy and improve their overall trading strategies.
How Can I Precisely Compute RSI in the Context of Cryptocurrency Trading?
Calculating the RSI in cryptocurrency markets involves averaging gains and losses over a defined period, typically 14 days. The RSI formula provides a quantitative measure for assessing price momentum, allowing traders to identify potential overbought or oversold conditions. Here’s how to accurately calculate RSI:
- Gather price data for the cryptocurrency over the last 14 periods.
- Identify daily price changes and categorise them into gains and losses.
- Calculate the average gain by summing all the gains and dividing by 14.
- Calculate the average loss by summing all the losses and dividing by 14.
- Determine the relative strength (RS) by dividing the average gain by the average loss.
- Utilise the RSI formula: RSI = 100 – (100 / (1 + RS)).
By consistently applying this formula, traders can effectively track the RSI value, facilitating the identification of market conditions that may indicate optimal entry or exit points. This quantitative approach adds significant depth to trading strategies, proving particularly beneficial in the rapidly changing cryptocurrency landscape.
What Limitations Should Traders Be Aware of When Using RSI?
While the RSI is a robust tool, it possesses limitations, particularly in the unpredictable realm of cryptocurrency trading. A primary concern is its tendency to generate false signals, especially during extreme market conditions. Due to rapid price fluctuations in cryptocurrencies, traders must remain vigilant, as RSI may not adequately capture sudden shifts prompted by news events or changes in market sentiment.
Moreover, during trending markets, the RSI can persist in overbought or oversold territory for extended periods, leading traders to misinterpret these signals. Therefore, traders should employ RSI alongside other analytical tools to enhance the robustness of their trading strategies. By integrating RSI with additional indicators, such as moving averages or volume analysis, traders can mitigate risks and improve their overall analysis, leading to more reliable trading results.
Practical Applications of RSI in Trading
What Actionable Steps Can Traders Take to Enhance RSI Usage?
Effectively utilising RSI can significantly improve trading outcomes in the cryptocurrency market. Below are actionable steps traders can adopt:
- Regularly monitor RSI to identify overbought or oversold levels.
- Combine RSI analysis with price action for more comprehensive insights.
- Utilise RSI divergences as early signals for potential trend reversals.
- Adjust RSI settings based on the specific cryptocurrency’s volatility.
For instance, if a trader observes that a cryptocurrency’s RSI has crossed above 70, this may indicate it’s time to exit a position or set a stop-loss order to protect gains. Conversely, if the RSI dips below 30, it could represent an opportunity to enter a long position, anticipating a price recovery. By implementing these practical steps, traders can optimise their strategies and increase the likelihood of successful trades.
What Advanced RSI Techniques Can Traders Leverage for Enhanced Results?
Advanced techniques for employing RSI enable traders to customise their approach to suit diverse market conditions. One technique involves modifying the RSI calculation period to adapt to varying volatility across specific cryptocurrencies. For example, in highly volatile assets, a shorter period (like 7 days) may be more suitable, providing quicker signals to capture fast-moving trends.
Another advanced method integrates RSI with additional indicators, such as moving averages or Bollinger Bands, to create more nuanced trading signals. For instance, combining a moving average convergence/divergence (MACD) with RSI can confirm bullish or bearish momentum, thereby enhancing decision-making. Traders should also be aware of specific market patterns and employ backtesting to evaluate which RSI settings yield optimal results across different market scenarios. By utilising these advanced techniques, traders can refine their strategies for increased accuracy and success in cryptocurrency trading.
What Risks Should Traders Consider, According to Experts?
While RSI is a valuable tool, experts caution traders about potential risks associated with its application in cryptocurrency markets. A primary concern is the occurrence of false signals, particularly during periods of high volatility. Sudden price shifts can mislead traders, leading to impulsive decisions that may result in losses.
Additionally, it is crucial to recognise that RSI should not be used in isolation. Experts recommend a balanced approach by integrating RSI with other technical indicators to validate signals. For instance, using RSI alongside trend lines or volume analysis can provide additional context to the signals generated by the index. This comprehensive approach mitigates risks and enhances the accuracy of trading decisions, ensuring that traders are well-prepared to navigate the complexities of the cryptocurrency market.
What Insights Do Experts Offer Regarding RSI in Crypto Trading?
Experts emphasise that comprehending and effectively utilising RSI in cryptocurrency trading requires understanding both its strengths and limitations. Staying attuned to market sentiment and recognising the inherent volatility in the cryptocurrency space are vital for successful RSI application. Traders should continually analyse their strategies and adjust them based on evolving market conditions to achieve the best possible outcomes.
Furthermore, expert insights suggest that traders maintain discipline and avoid emotional responses to market fluctuations. By relying on data-driven decisions derived from RSI analysis, traders can enhance their focus and precision, ultimately leading to improved performance. A grounded approach to cryptocurrency trading, supported by reliable RSI insights, can significantly boost traders’ chances of success in this dynamic market.
Effective RSI Strategies for Successful Trading
How Can Traders Integrate RSI with Other Trading Tools for Maximum Efficiency?
Integrating RSI with other tools can substantially enhance trading accuracy and reliability in cryptocurrency markets. Here are several effective methods for merging RSI with other indicators:
- Pair RSI with moving averages to confirm trends.
- Utilise volume indicators to validate RSI signals.
- Apply Bollinger Bands to assess volatility alongside RSI readings.
- Incorporate Fibonacci retracement levels to help identify potential reversal zones.
For instance, a trader may observe an RSI reading above 70, indicating overbought conditions, and then seek confirmation through a bearish moving average crossover. This combination enhances the reliability of the signal, reducing the likelihood of false entries or exits. By leveraging these integration methods, traders can develop a comprehensive trading strategy, promoting greater success as they navigate the cryptocurrency landscape.
How to Identify Optimal Entry and Exit Points Using RSI Effectively?
Utilising RSI effectively to time trades can enhance profitability in cryptocurrency markets. Traders can analyse RSI readings to identify optimal entry and exit points based on shifts in momentum. For example, when the RSI exceeds 70, it often indicates that a cryptocurrency is overbought, suggesting it may be the right moment to consider selling or taking profits. Conversely, an RSI reading below 30 signifies an oversold condition, signalling a potential buying opportunity.
Additionally, traders can refine their strategies by monitoring divergence patterns between price action and RSI. If the price is making lower lows while the RSI forms higher lows, this bullish divergence can signal a potential upward reversal. By acting on these insights, traders can improve their timing, maximising potential gains and minimising losses in their cryptocurrency investments.
Why Is It Important to Tailor RSI for Different Cryptocurrencies?
Adapting RSI settings for different cryptocurrencies is crucial due to the varying levels of volatility and price behaviours across assets. Cryptocurrencies like Bitcoin may exhibit lower volatility compared to altcoins, necessitating distinct RSI parameters for more accurate analysis. For instance, a trader might apply a longer RSI calculation period for Bitcoin (such as 21 days) while shortening it for more volatile assets like Shiba Inu or Dogecoin (14 days or less).
Furthermore, customising RSI parameters based on trading strategies can enhance prediction accuracy. For day trading versus swing trading, traders might want to adjust the timeframes to align with their specific styles. By tailoring the RSI to the characteristics of individual cryptocurrencies, traders can enhance their strategies, ensuring more effective analysis and improved trading outcomes.
How to Identify RSI Divergences for Crypto Trading Signals?
Recognising RSI divergences is vital for identifying potential price reversals in cryptocurrencies. A bullish divergence appears when the price of a cryptocurrency reaches lower lows while the RSI forms higher lows. This pattern indicates that while the price is declining, momentum is weakening, suggesting a possible upward reversal. Traders should seek confirmation of this signal through additional indicators or price action.
Conversely, a bearish divergence occurs when the price makes higher highs while the RSI records lower highs. This discrepancy signals that the upward momentum is faltering, often preceding a price correction. Traders can enhance their predictive accuracy by integrating divergence analysis with other technical indicators, thereby identifying potential entry or exit points more effectively and capitalising on market trends.
What Role Does RSI Play in Risk Management for Cryptocurrency Trading?
Incorporating RSI into risk management strategies is essential for safeguarding capital in cryptocurrency trading. Traders can utilise RSI to set stop-loss levels based on overbought or oversold conditions, effectively managing their exposure to adverse price movements. For example, if a cryptocurrency’s RSI reaches above 70, it may indicate an impending downward correction, prompting traders to tighten their stop-loss orders to protect recent gains.
Moreover, combining RSI analysis with position sizing strategies can enhance overall risk management. By adjusting the size of each trade based on RSI indications, traders can ensure they are not overexposed to any single position. This prudent approach guards against significant losses and promotes more sustainable trading practices, allowing traders to navigate the volatile crypto markets more effectively.
Research-Backed Benefits of the Relative Strength Index (RSI) in Crypto Trading
What Real-World Examples Highlight the Effectiveness of RSI?
Research and analysis have substantiated the effectiveness of RSI in identifying trends within cryptocurrency markets. Numerous case studies illustrate how traders have successfully utilised RSI to time their trades effectively. For instance, during a notable market rally in 2020, traders who monitored RSI readings identified overbought conditions and took profits before subsequent price corrections. Such real-world applications underscore the practical advantages of RSI in enhancing trading strategies.
Moreover, many successful traders credit RSI as a pivotal component of their trading toolkit. By employing RSI alongside other technical indicators, they have achieved consistent performance across various cryptocurrencies. This evidence supports the notion that when used correctly, RSI can serve as a reliable indicator for making informed trading decisions and maximising potential returns.
What Are the Long-Term Advantages of Consistently Monitoring RSI?
Long-term monitoring of RSI can yield sustained benefits, particularly concerning risk management in cryptocurrency trading. By consistently applying RSI analysis, traders can gain a deeper understanding of market dynamics and trends, leading to enhanced portfolio performance over time. The ability to consistently identify overbought and oversold conditions allows traders to adjust their strategies and maintain a balanced trading approach.
Furthermore, regular use of RSI fosters discipline and helps traders avoid emotional decision-making. As traders rely on this quantitative measure, they become more adept at navigating market fluctuations without succumbing to fear or greed. This disciplined approach contributes to long-term success in cryptocurrency trading, enabling traders to build and protect their capital more effectively.
How Does RSI Support Trend Analysis in Cryptocurrency Trading?
The RSI plays a crucial role in supporting trend analysis within cryptocurrency markets. By confirming trends, RSI helps traders distinguish genuine price movements from temporary fluctuations. When the RSI remains above 50 during an upward trend, it often signifies strong bullish momentum, providing traders with the confidence to maintain long positions. Conversely, when the RSI remains below 50 in a downtrend, it signals that bearish sentiment is prevailing, guiding traders to consider short positions or exit strategies.
Moreover, studies have indicated that RSI is effective in predicting both trend continuations and reversals. When traders observe an RSI reading approaching extreme levels (above 70 or below 30), they can anticipate potential shifts in market direction. By incorporating RSI into their trend analysis, traders can enhance their predictive capabilities and make more informed decisions, leading to greater overall trading success.
How to Effectively Interpret RSI Signals in Trading?
What Signals Indicate Overbought Conditions in the Market?
Signals suggesting overbought conditions in cryptocurrency markets typically emerge when the RSI reading exceeds 70. This level often implies that a cryptocurrency may be overvalued and due for a price correction. Traders should monitor these signals closely, as they represent critical moments to consider taking profits or implementing risk management strategies.
When the RSI is above 70, it can serve as a warning that upward momentum may not be sustainable. Traders need to corroborate this signal with other indicators or market analyses to ensure they make informed decisions. For example, if the RSI indicates overbought conditions but price action remains strong, it may necessitate further investigation before taking action. Utilising multiple analyses alongside RSI can optimise trading strategies and yield better outcomes.
What Are the Signs of Oversold Opportunities in Cryptocurrency Trading?
Conversely, oversold conditions are indicated when the RSI falls below 30, suggesting a cryptocurrency may be undervalued and poised for a price rebound. This signal encourages traders to contemplate entering long positions, recognising the potential for a price increase. Just as with overbought signals, it is crucial to verify these indications with additional market analysis.
Traders should exercise caution regarding false signals that may arise during periods of extreme volatility. Therefore, even when the RSI indicates oversold conditions, it’s wise to assess the overall market sentiment and other technical indicators to validate the trade. By integrating multiple signals into their analysis, traders can increase their chances of successfully capitalising on oversold opportunities.
What Divergence Patterns Should Traders Recognise in RSI for Accurate Signals?
Divergence patterns in RSI are critical for forecasting potential price reversals. These patterns arise when a cryptocurrency’s price action and the RSI move in opposite directions. A bullish divergence occurs when the price makes lower lows while the RSI forms higher lows, signifying a weakening bearish momentum and suggesting a potential upward reversal.
Conversely, a bearish divergence manifests when the price reaches higher highs while the RSI records lower highs, indicating a potential downtrend. Recognising these divergence patterns is crucial for proactive trading adjustments, as they provide valuable insights into market sentiment. Traders should look for confirmation of these divergences using other technical indicators or price trends to improve the accuracy and effectiveness of their trades.
Proven Strategies for Effectively Using RSI in Cryptocurrency Trading
What Key Tactics Should Traders Implement for Effective RSI Usage?
Implementing RSI effectively involves several key tactics that can significantly improve trading outcomes in the cryptocurrency market. One strategy is to establish clear entry and exit rules based on RSI readings, ensuring that traders act decisively when specific thresholds are reached. For instance, setting a rule to sell when the RSI exceeds 70 and buy when it falls below 30 can help maintain consistent trading discipline.
Another tactic is to use RSI in conjunction with trend analysis to provide a more comprehensive view of market conditions. By observing the overall trend while relying on RSI signals, traders can align their strategies with prevailing market momentum. This dual approach enhances decision-making, increasing the probability of successful trades.
How Can Traders Prevent Common Pitfalls When Using RSI?
To maximise the effectiveness of RSI, traders must avoid common pitfalls associated with its application. One frequent mistake is relying solely on RSI without considering the broader market context. This oversight can lead to misinterpretations of signals, particularly in trending markets where RSI may remain overbought or oversold for extended periods.
Another pitfall is neglecting to validate RSI signals with additional indicators. Traders should always seek confirmation through price action or other technical tools before acting on RSI readings. By refining their strategies and maintaining a well-rounded analytical approach, traders can enhance their accuracy and reduce the likelihood of impulsive trades that lead to losses.
What Advanced Customization Options Are Available for RSI Settings?
Advanced customisation of RSI settings can further optimise its performance in cryptocurrency trading. Traders should consider adjusting the calculation period based on the specific cryptocurrency being analysed. For instance, a more volatile asset may require a shorter RSI period to capture rapid price movements, while less volatile cryptocurrencies may benefit from longer periods to produce smoother signals.
Additionally, traders can experiment with the overbought and oversold thresholds to suit their trading styles. While the standard thresholds are set at 70 and 30, adjusting these levels based on individual asset characteristics can enhance accuracy. By tailoring RSI parameters to market conditions and personal trading strategies, traders can increase their chances of success in the ever-evolving cryptocurrency landscape.
What Are the Main Drawbacks of RSI in Trading?
What Are the Primary Limitations Associated with Using RSI?
Despite its advantages, RSI comes with notable drawbacks that traders must consider. One primary limitation is its tendency to produce false signals, particularly in highly volatile markets such as cryptocurrencies. Sudden price movements can lead to misleading RSI readings, resulting in hasty trading decisions.
Furthermore, RSI may be less effective in ranging markets where prices fluctuate within defined boundaries. In such conditions, the index can provide mixed signals, making it challenging for traders to identify clear trends. As a result, it is crucial for traders to be aware of these limitations and to use RSI alongside other analytical tools to ensure a more comprehensive understanding of market dynamics.
How Can Traders Complement RSI with Other Indicators for Enhanced Analysis?
Complementing RSI with other indicators is essential for enhancing overall analysis and trading effectiveness. Combining RSI with oscillators, such as the Moving Average Convergence Divergence (MACD), can provide additional clarity on momentum and trend strength. When both indicators signal similar trends, it reinforces the reliability of the analysis.
Furthermore, pairing RSI with trend lines or moving averages can help traders identify significant support and resistance levels, further validating trade signals. By integrating multiple indicators into their strategies, traders can address the limitations of relying solely on RSI and improve their overall trading effectiveness, leading to more informed, strategic decisions.
What Future Adaptations Can Enhance RSI’s Relevance in Trading?
As cryptocurrency markets continue to evolve, future adaptations of RSI will likely centre on enhancing its relevance and effectiveness. Innovations in market analysis tools and the integration of AI-driven algorithms could lead to more advanced iterations of RSI, providing traders with deeper insights into market dynamics.
Additionally, as new cryptocurrencies emerge and trading behaviours change, adapting RSI settings to align with these developments will become increasingly important. Both retail traders and institutions will need to explore innovative applications of RSI in response to market changes, ensuring that this valuable tool remains a staple in effective trading strategies.
Frequently Asked Questions (FAQs)
What is the Fundamental Concept of RSI in Crypto Trading?
RSI, or Relative Strength Index, is a momentum oscillator utilised to measure the speed and change of price movements in cryptocurrencies, assisting traders in identifying overbought or oversold conditions.
How Can I Calculate RSI Values for a Cryptocurrency?
To calculate RSI, determine the average gains and losses over a specified period, typically 14 days, and apply the RSI formula: RSI = 100 – (100 / (1 + RS)).
What Are the Critical Components of RSI Charts?
RSI charts display critical levels at 30 and 70, indicating oversold and overbought conditions, respectively, alongside the RSI line that tracks momentum.
How Does RSI Function in Crypto Trading?
RSI compares upward and downward price movements to signal potential trends, helping traders effectively monitor market dynamics.
What Are the Primary Benefits of Using RSI for Trading?
RSI enhances decision-making by highlighting momentum shifts, enabling traders to make data-driven decisions and avoid emotional trading.
How Can I Identify Common RSI Indicators?
Common RSI indicators include crossovers at the 30 and 70 thresholds, as well as divergence patterns that signal potential trend reversals.
What Advanced Techniques Can Improve RSI Analysis?
Advanced techniques include adjusting RSI periods to volatility, combining it with other indicators, and using backtesting to optimise trading strategies.
What Risks Should I Be Aware of When Using RSI?
Risks include false signals during volatility and the necessity for complementary indicators to reinforce trading decisions and mitigate potential losses.
How Can I Enhance My RSI-Based Trading Strategies?
Integrate RSI with other technical tools, establish clear entry and exit rules, and continuously analyse performance to refine strategies for better outcomes.
What is the Role of RSI in Risk Management for Crypto Trading?
RSI aids in risk management by helping set stop-loss levels based on overbought or oversold conditions, protecting traders from significant losses.
Connect with us on Facebook today!
The Article RSI in Crypto Trading: A Beginner’s Guide Explained Was Found On https://limitsofstrategy.com
The Article RSI Explained: A Beginner’s Guide to Crypto Trading found first on https://electroquench.com